
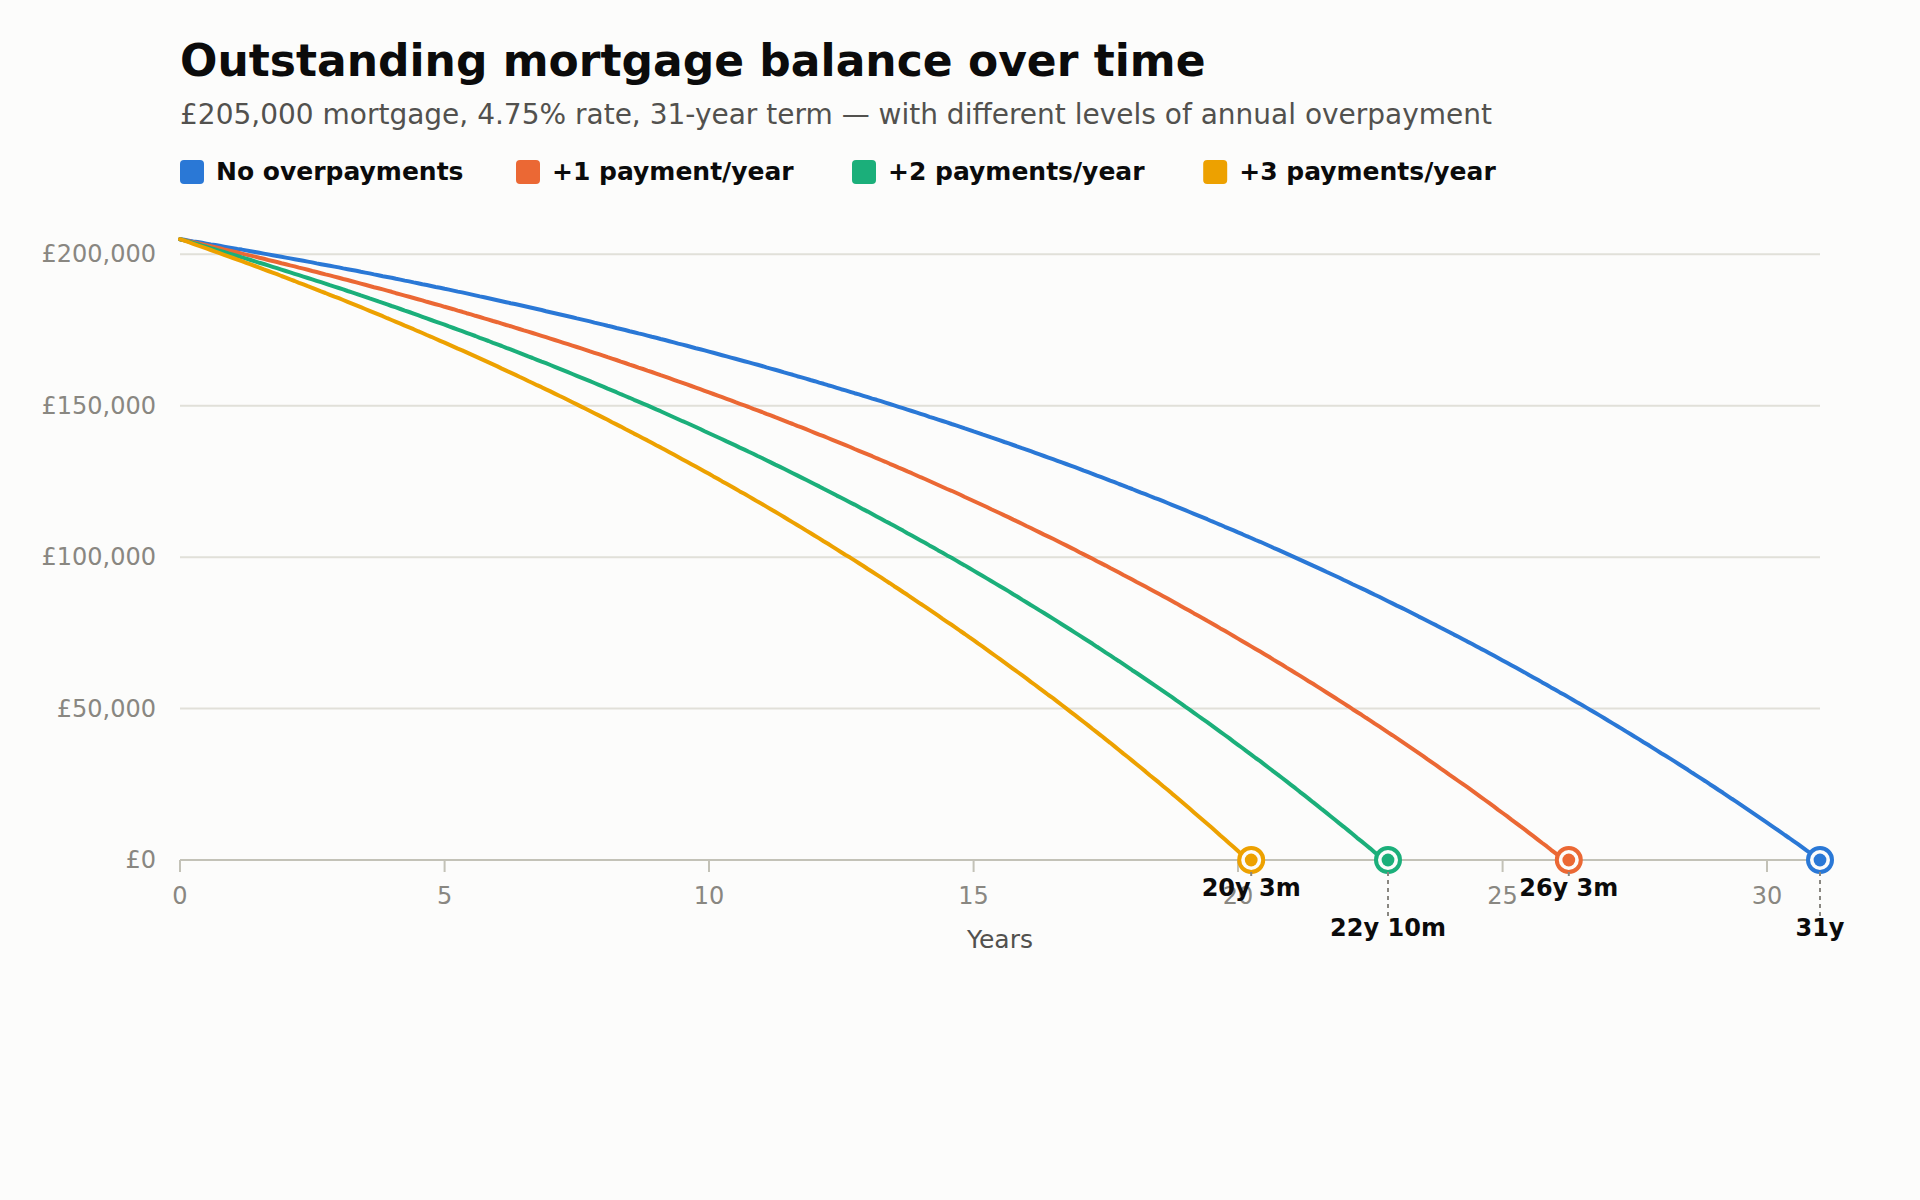
This chart plots the outstanding balance on a £205,000 repayment mortgage at 4.75%, comparing four scenarios: no overpayments (31-year term), and the equivalent of one, two or three extra monthly payments added evenly across each year. Each line ends at the point the mortgage is fully repaid — 31 years with no overpayments, 26 years 3 months with one extra payment a year, 22 years 10 months with two, and 20 years 3 months with three. The chart illustrates how mortgage overpayments accelerate the decline in balance and shorten the overall term.


